
About Project
Lehigh Valley Breathes is a project led by Lehigh and Northampton Counties to obtain and communicate localized information about particulate air pollution in the Lehigh Valley. The primary purpose is to provide policy makers and citizens with information needed to help improve the air we all breathe. The project is designed to enable and engage citizens in learning about air quality and participating in decisions that affect air quality.
How the Project Works
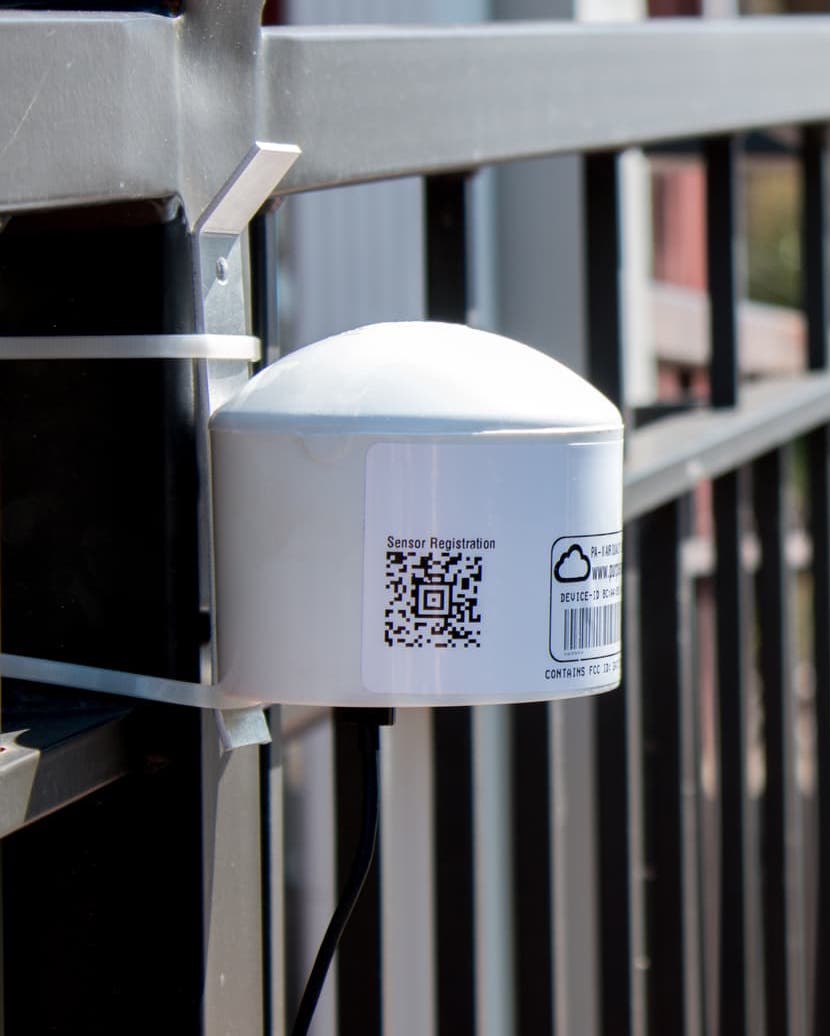
The two counties have purchased the 40 monitors for use in the project. We are planning to collect data for a full year so that we can assess pollution across all four seasons and in all types of weather. If you are interested in participating and in a location where we need an air monitor, we will ask that you allow us to install a PurpleAir monitor at your location. You can learn much more about the monitors at their website www.purpleair.com.
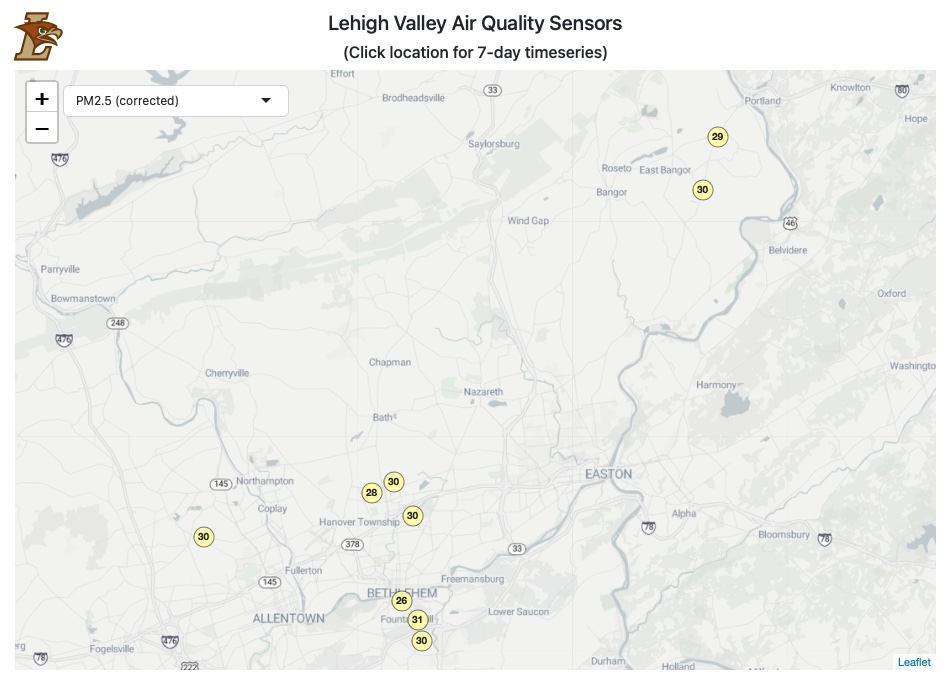
The data collected from the air monitor at your location will be made publicly available in real time on the Shiny App.For a more detailed explanation of how the Shiny App works, go to What Does the Data Mean?
Why Does This Matter?
PM 2.5 pollution presents a serious risk to human health and the environment. This pollution is comprised of very small particles that are often invisible to the naked eye. The “2.5” is a reference to the size of the particle, which is 2.5 microns or less in diameter, or about 1/30th the width of a piece of human hair. Inhalation of these small particles is associated with a number of respiratory problems. The particles irritate the airways and bypass the body’s normal defense mechanisms lodging themselves deep within the lungs where they can cross into the bloodstream. For those who are already immunocompromised, as well as children and the elderly, the risk is even more substantial.
- Aggravated asthma
- Decreased lung function
- Nonfatal heart attacks
- Birth defects
- Dementia
- Premature death
- Depleting nutrients in the soil
- Affecting biodiversity of ecosystems
- Damaging forests
How You Can Get Involved
As we begin the project, we are looking for property owners who would be willing to have us install a PurpleAir monitor on their home or business. This is essential to our success in characterizing air quality throughout the Valley.
If you are willing to host an air monitor, you must meet the following two requirements.
Installation requirements. Each monitor requires a source for electricity, preferably an outdoor outlet, and a WiFi connection. The monitor is usually positioned at about lung level and takes only one screw to attach to your building; it is approximately the size of a softball. If you prefer, we can also install it with a Ziptie. The monitor only sends data to the website and does not in any way interfere with your WiFi network. If you volunteer to participate, we’ll provide more details about installation. There is no cost involved to you.
Location requirements. There are two different types of locations where we will be installing monitors: (1) locations where there are likely to be elevated levels of PM 2.5 and (2) locations far away from sources of PM 2.5, where we can begin to get baseline readings of PM 2.5 unaffected by those sources.
The link below will take you to an interactive map that identifies those areas of the Lehigh Valley where we expect there may be elevated levels of PM 2.5 coming from warehouse related truck traffic. The gray areas on the map show those areas. We are looking for installation sites within those areas. After you click link to access the map (which is a satellite image and may take a few minutes to load), you can enter your address in the search box in the upper right corner of the map and then click on the search icon. The interactive map will then drop a pin on the map showing your location relative to those areas where we expect to find traffic related PM 2.5 pollution. You can use the “+” and “-“ icons on the map to zoom in and out of your location.
If your address is within one of those gray areas, we would definitely like to talk with you about installing a monitor.
Please contact us via email (LVBreathes@gmail.com).
If your address is not within a gray area, but you are still interested in participating, please contact us via email (LVBreathes@gmail.com)
with your address and we’ll be happy to talk further about whether your site is a useful one for the project.
Lehigh Valley Breathes, interactive map for air sampling locations
What Else Is Coming?
We’re just getting started on installations. We spent the first 5 months of the year calibrating all 40 monitors. Our aim is to get all the monitors installed during the Fall of 2023. As the project progresses, we’ll be adding more information to this webpage so keep checking back. We’ll have analysis of the data to share, news releases, additional information on health impacts, and information on other air quality projects that are happening across the country. There’s a big successful one in Pittsburgh that our project is modeled on.
If you’d like to be added to our email list, please send an email to LVBreathes@gmail.com and put “Email List Request” in the Subject line. We’ll make sure you’re added and kept up to date.