
Project Overview
The Lehigh Valley Breathes project will distribute and install 40 PurpleAir monitors throughout the Valley to measure particulate pollution, which commonly referred to as “PM 2.5” and poses a serious health risk for humans and the environment. These small and inexpensive air monitors can be easily positioned in different locations, providing a highly-localized understanding of air quality that the state’s two centralized air monitors cannot.
By increasing the locations where PM 2.5 pollution is measured, the data will provide a more accurate understanding of how PM 2.5 is impacting the health of citizens in different parts of the Valley. And because the data provided by the PurpleAir monitors are available 24/7 on an easily accessible and dedicated website, Lehigh Valley residents can easily check on the air quality in their own neighborhoods.
What Does the Data Mean?
You don’t have to be a scientist to interpret these results!
Click on the map to see the real-time data
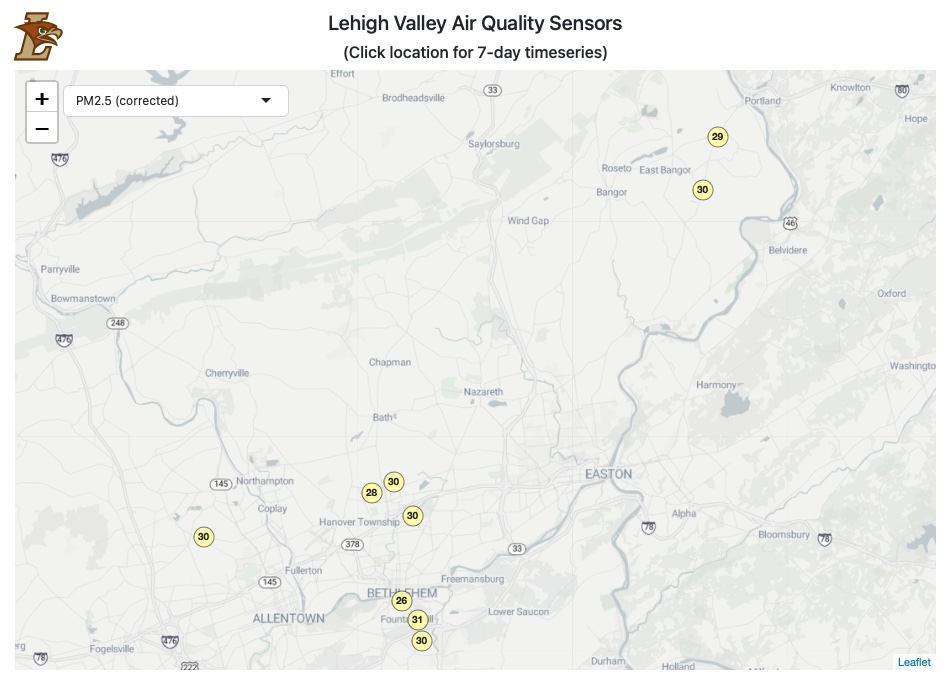
The Shiny App website provides 24/7 data from each of the PurpleAir monitors installed throughout the Lehigh Valley as part of the LV Breathes Project.
As the project progresses, you’ll see more monitors added to the list.
The website includes data on total amount of PM 2.5 pollution in the area where the monitor is located, as well as the Air Quality Index (AQI) rating for each area, which is discussed below. For each monitor, citizens can select 4 different measurement of air quality: (a) real time measurements at the time the data is accessed, (b) measurements averaged over the past 10 minutes, (c) measurements averaged over the past hour, and (d) measurements averaged over the past week. The readings are color-coded to identify the level of concern associated with different amounts of PM 2.5 pollution. Click on the monitors represented by the colored circles on the map to see the real-time data.
To add the link to the Shiny App to your phone’s home screen, follow these easy steps.

In the United States, measurements of daily air quality are described through the Air Quality Index (AQI). While the general AQI covers various pollutants regulated by the Clean Air Act, this project focuses on fine particulate pollution (PM 2.5), which is emitted from vehicles that use internal combustion engines, among other sources. Currently there is no distributed air monitoring network in the Lehigh Valley for PM 2.5 pollution. This project is designed to fill that void.